funnily enough, i’ve been looking recently at the numbers for a period where I felt on fire, and was hitting new PBs everywhere, and the big and obvious differences are
Much more intensity work. Lots of micro intervals, and also, my steady 1 to 1.5hr rides (not the long and slow) were all on zwift, on climbs, so making me work much more towards sweet spot than previous easy efforts
Cadence was significantly higher than currently.
I’m going to take a look and see what changes I might need to make.
It’ll be interesting to watch the video associated with the above charts, and see what insights that offers.
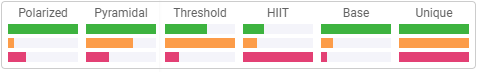
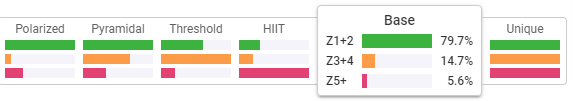
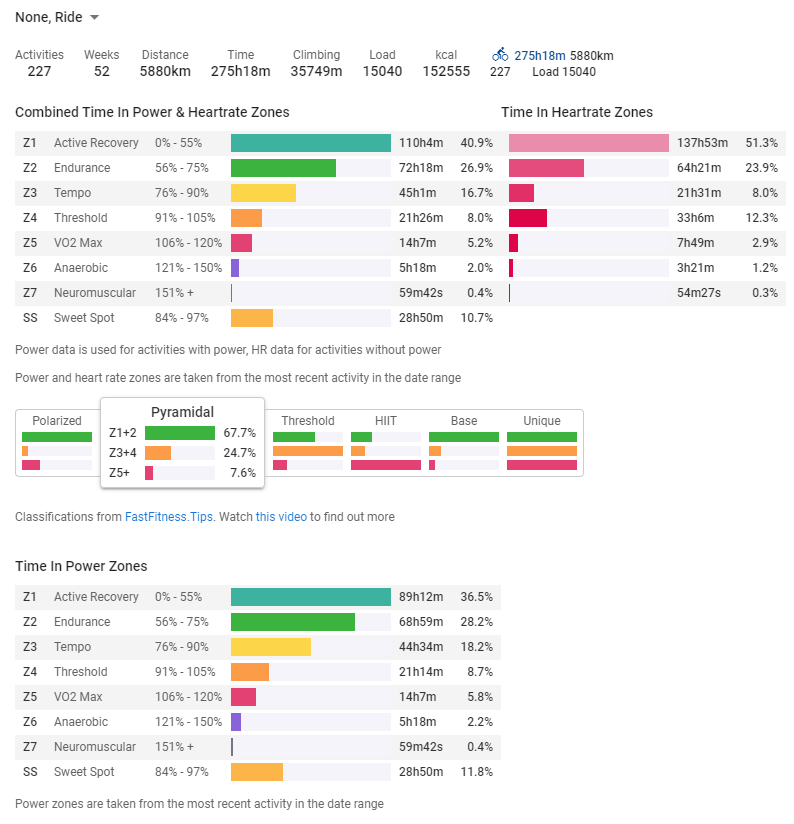
Looking a bit further, and comparing your charts to mine, you come up with generic template distributions as follows:
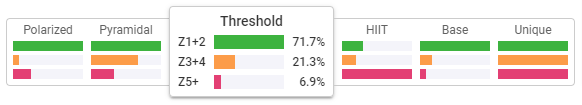
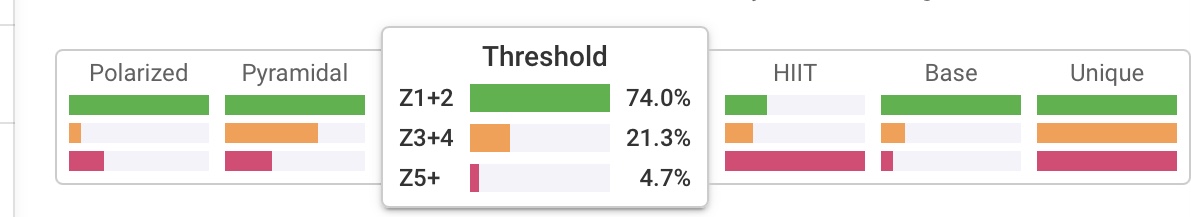
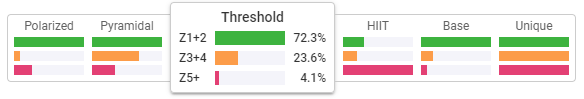
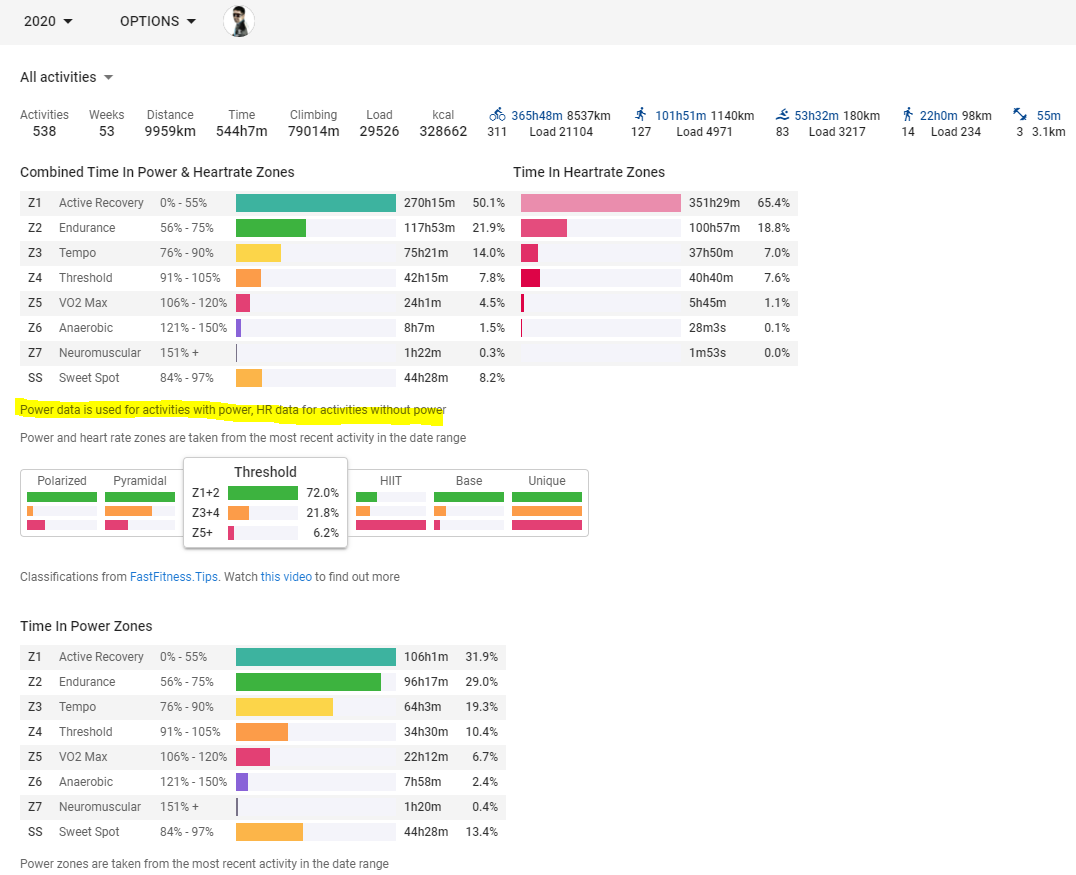
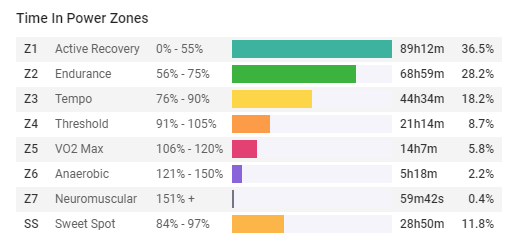
Looking at the default Threshold chart, I’m not entirely clear how I end up getting bucketed in that category? It seems like the suggestion should be more Z3/4 than Z1/2, yet if we compare our two charts, I spend more time in Z1/2 and less in Z3/4. The key difference is you spend a fair bit more in Z5+, so maybe it’s my lower percentage of top end that is the key determinate?
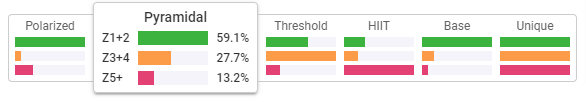
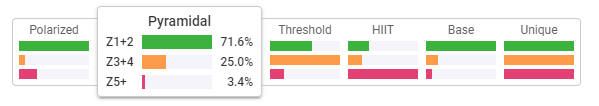
Looking back, I do get categorised as pyramidal myself for 2018, which was my last full IM year, so maybe it depends on relevant focus. What is clear is that I’m not doing very much high intensity stuff at all, which I knew was true. It was something I acknowledged very clearly in my 2019 marathon build, and actually advocated at the time. I felt doing a lot of race pace duration runs really dialled in my comfort at that effort level.
What’s really scary is my full year totals, and the lack of swimming. I did over 90hrs of swimming in 2018, versus none so far in 2021. If I am to get back anywhere near the hour for 3.8k, then that is going to require a serious amount of work!
I think the lack of races in 2020/21 has resulted in me spending more time in Z1/2. I was more focused on weekly anaerobic workouts in 2019. I’ve started trying to do more again as I’ve noticed a lack of top speed.
Yep, that concurs with my thoughts too when I look in more detail and also watch the FFT video.
I’d add that, while my chart shows a pyramid, the reality is that a lot of my Z1/2 stuff is towards the top of that segment, and a lot of the Z5+ towards the lower, and i’m quite a classic case of lots of middle ground efforts at 75% to 85%…
It would suggest that I need to do more REALLY easy work, and shift the hard stuff to being REALLY hard, perhaps more heavy duty interval efforts. I struggle for example, to ride on Zwift on the Tempus Fugit 10M TT course and not make it a tempo ride… and I need to learn to just sit up and be happy riding on a flat course at 15mph for a change.
Sounds like my club 10’s that start again next week could be perfect timing for a really hard ride once a week!
Swimming is a whole different matter. I’ve always been a crap swimmer, so my fall off from not swimming is less painful, as its only from rubbish to awful!
Interesting seeing the trends. Made me look back. I do wonder how it’s getting the right “zones” in these earlier years - does it automatically use the eFTP it calculates to judge relevant training stress?
2018
2019
2020
2021
There’s really very little fluctuation. The only really observable difference from my perspective is that 2020 has a good 60%+ increase in the high intensity percentage. Still relatively small, but a noticeable uptick. That can realistically only be a consequence of joining zwift.
Think you have to scroll to the earlier periods, and then that will force it to start pulling in that data. I initially had nothing for 2018, yet setting the calendar manually to 2018 (and then 2017, and so on), seemed to trigger that data being pulled in and facilitated the above earlier outputs. It’s currently finalising a data pull from 2017 and 2016 as I write
You can’t get to vo2max power levels?
If I’m not well above vo2max at the banner drop in a zwift race, let alone during points of the race itself, I’m getting dropped instantly.
I could do vo2max power, but not in a situation where the HR will get there no, I will always drop before the HR catched up, with intermitent sprint efforts I can get right to the top of zone 4, but not into 5, and not for very long, certainly in perceived effort terms it’s really hard, but I’m clearly not needing the O2 to do it!
Oh, you’re talking about HR? My HR on zwift will be sky high, I believe because of the heat. I’ll be up within 10 beats of max for pretty much a whole race, simply due to the start and then it will never drop, despite the fact that power will have dropped significantly, in multi hour races to even below threshold.
I’ve hit over 190bpm a number of times on zwift, yet even outside on the bike I’d struggle to get to the high 180s. My HRmax on the bike has always been lower than on the run … pre-zwift I don’t think I’d hit anything higher than about 186, despite having hit c200 in XC events
Yeah, I was assuming the interals stuff is HR based, 'cos cycling power zones are not as reflective in the same way, a few seconds of vo2max power every time you pull away from the lights is pretty normal for lots of people, and not in the o2 systems at all so unrelated really and wouldn’t register in HR terms at all, but in stop/start noodling could soon add up to something more significant in the chart.
Whilst I see your point in theory, I’m not sure the few seconds of traffic light surges would have much effect on the overall scale. My 2020 data for example is based on 544hrs of training. Even 0.1% of my training distribution is over half an hour, and that’s not realistic (for me at least).
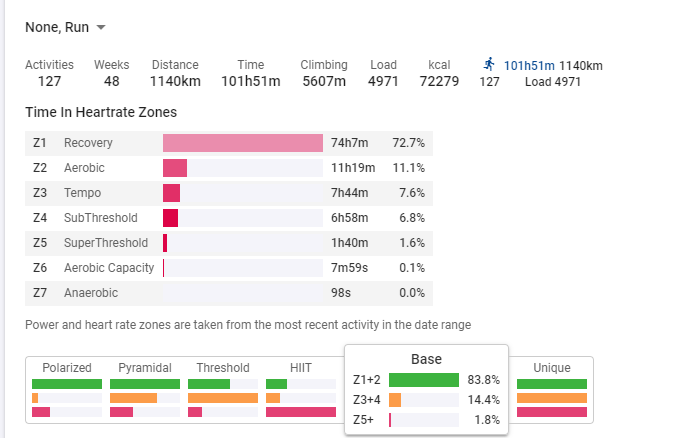
The page does say it’s using power for power data files however. The thing I’m unclear about is what it uses for me on running, as I use stryd. I don’t believe it’s using that, unlike training peaks, as there’s no way to input CP into the site.
The sentence under the highlighted line does seem to suggest annual data is going to be a little bit skewed however, as it’s going to be working from power zones computed at 31/12/xx each time. If it’s using it’s own calculated eFTP for that, then I would assume most people are a little bit low at percentages, they’re possible being overstated as they’re being compared to an FTP figure that is potentially understated
I think there’s quite a difference in scale, between power and HR, even you who presumably have had loads of zwift, loads of regulated training and almost no group rides are going to have a lot less transient accellerations than people who ride outdoors, in group rides (where you need to accellerate often to be stay together etc.) and you’ve got 9.5% Zone 5+ power and 1.2% Zone 5 HR that’s quite a difference!
Although with single FTP then it’s even more dodgy as you say! Even people who train all year can move 10-15%, the folk who take the winter off can easily move 20-30% within the year.
Yeah, the single point in time reference value is definitely a weakness. It really needs to be assessing things against the rolling eFTP it is calculating already.
On the percentages, I think that’s again probably reflective of the fact it’s using a single LTHR for both running and cycling. Garmin Connect for example allows you to specify separate ones, as does Training Peaks I think. And as mentioned above, I can’t get my HR up to the same levels as running when on the bike. I’ll run a HM at 178ish ave, but looking at some 10TT’s (which are short duration in comparison), I’ve done those at 170ish ave. And alternative comparison is a 5k, which I’ll do into the low 180s ave, despite the reasonable impact of the low starting point on the overall average. So a HRbike distribution based on my HRrun zones is always going to be off
Edit to add:
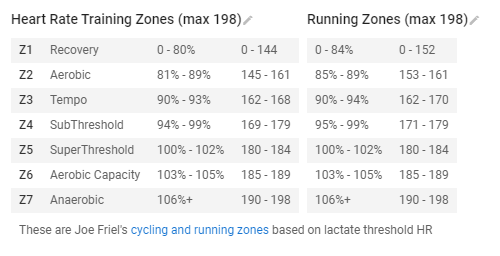
Just found the following in settings. So I think the first section is the cycling HR zones, which I should adjust
The running zones are about spot on, with sub and supra threshold spanning that 180ish mark
The question becomes what to set as my LTHR on the bike. I really have no idea.
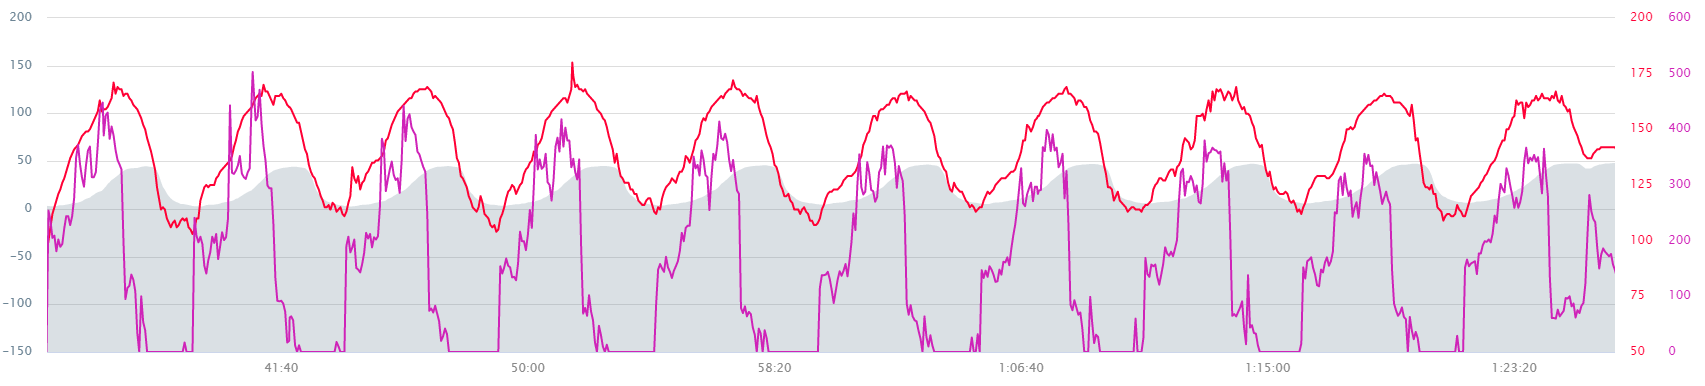
As has been implied, HRlag is too much on shorter intervals, such as the below hill repeat session the other week. It doesnt get above 170ish.
My box hill PB HRave is 180, and that was well above sustainable. Peaked at 186. Other top 3 efforts are 165 (173max) and 171 (177max). So a finger in the air of 170ish seems to make some kind of sense. And loosely aligns with what I did in historic 10’s.
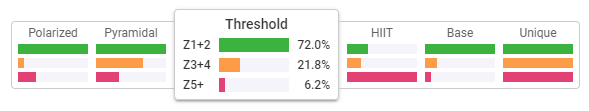
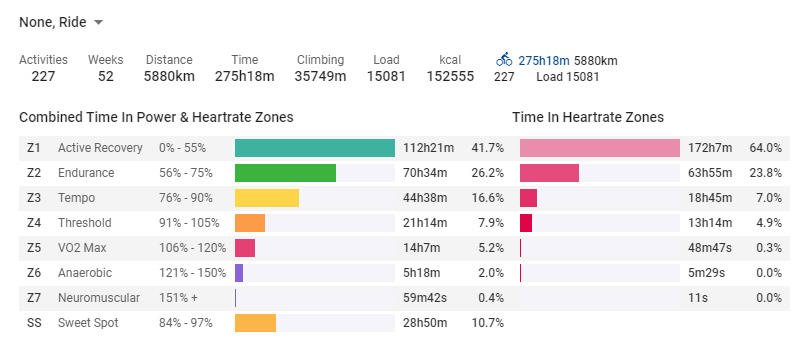
That changes the data I presented above for bike only as follows:
No you won’t.
Pretty much same as TP/strava/anywhere else given their TSS scores from pace zones are complete finger in the air for swimming, I reckon probably more accurate to make one up from how you feel.