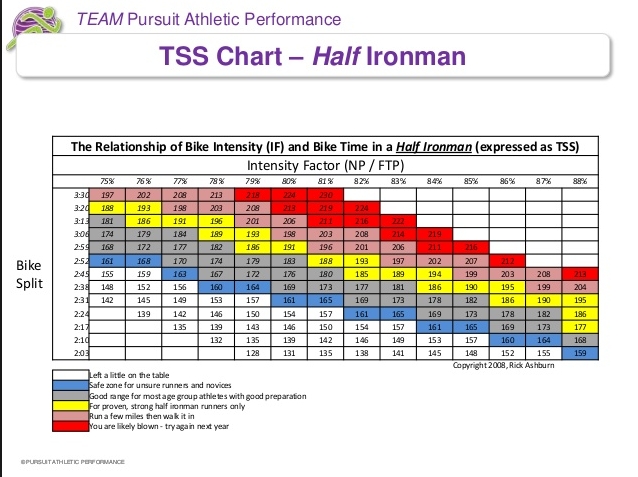
Does one of these exist for a 70.3?
1 Like
How do I google that?
That chart came from a link on Slowtwitch. Google “TSS for half iron bike”.
1 Like
No, VI is not an available Garmin data field. It’s just NP/AP though, so if you have both then you can quite quickly work out if the two are diverging.
That’s actually the slowest way to ride. For the same NP/IF/TSS, doing the exact opposite (obviously within reason) will yield a faster bike split.
1 Like
What’s BBS?
I don’t class myself as a proven strong IM runner, but HIM is different. I was at 1:29 off a 1:23 standalone pace (~7% slowdown, which correlated to each years HIM/HM)
Two test rides for me so far;
0.83 IF, 177TSS, 2:34:05, VI 1.02
0.75 IF, 150TSS, 2:45:38, VI 1.05
I couldn’t run after the first one, but it was my first outing on the TT bike at race pace and also my first brick in about six years.
Second one was a piece of pie and I could’ve done it again.
I’ve got three more opportunities to do a 90km-100km Ride. Aiming to do the next one at 0.83IF and see if I can run off the bike this time.
Best bike split
1 Like
Yes, sorry!!! It’s about maintaining the fastest minimum speed at all times.
It is what I meant. But doesn’t read like that at all!!!
For most people, riding a hill at 67-80% of FTP feels like soft-pedalling (it certainly does for me!)
But then maintaining the same downhill is very difficult. Which is why most people totally coast the downhills, as they’ve goosed themselves going uphill!!!
1 Like
What I was actually meaning is if you want to ride at 0.8 IF for the whole ride, then the fastest time will be achieved by going at, say, 0.9-0.95 uphills, and then cruising the downhill. The added speed from the extra exertion is increased as with slower speeds it means air resistance is less impactful. Working hard downhill has a lower speed return on power output, given the non-linear increase in drag with respect to speed.
This is what Best Bike Split helps with.
1 Like
I think that HIM TSS/IF chart is a little optimistic. I don’t think riding at .85 for around 2:30 is really in the ‘safe’ (grey) zone, to allow a good run afterwards for ‘well prepared’ AGers. That’s an opinion, but I reckon the data of others would probably bear that out.
1 Like
I’ll let you know on Friday ![]()
1 Like
I’m not sure what the science says but this will be similar to my approach for Lanza and any hilly course. In the past I’ve preferred to keep the power up on the downhills but I think that better suited to a less jagged bike course profile.
I think 90-95% may be a bit too hard over IM distance more like 80% but definitely cruising effort on the downhills.
Best way to prep/check is to ride 90k on similar elevation route and see the TSS you generated. I found that even with my risk-averse approach to hills I’d hit the time target but blow the TSS out of the water with seemingly innocuous efforts that added up over the route.
Exactly this!
Which is why HIM is awesome, because you can go out and do 90-100km at race intensity without needing a year to recover 
1 Like
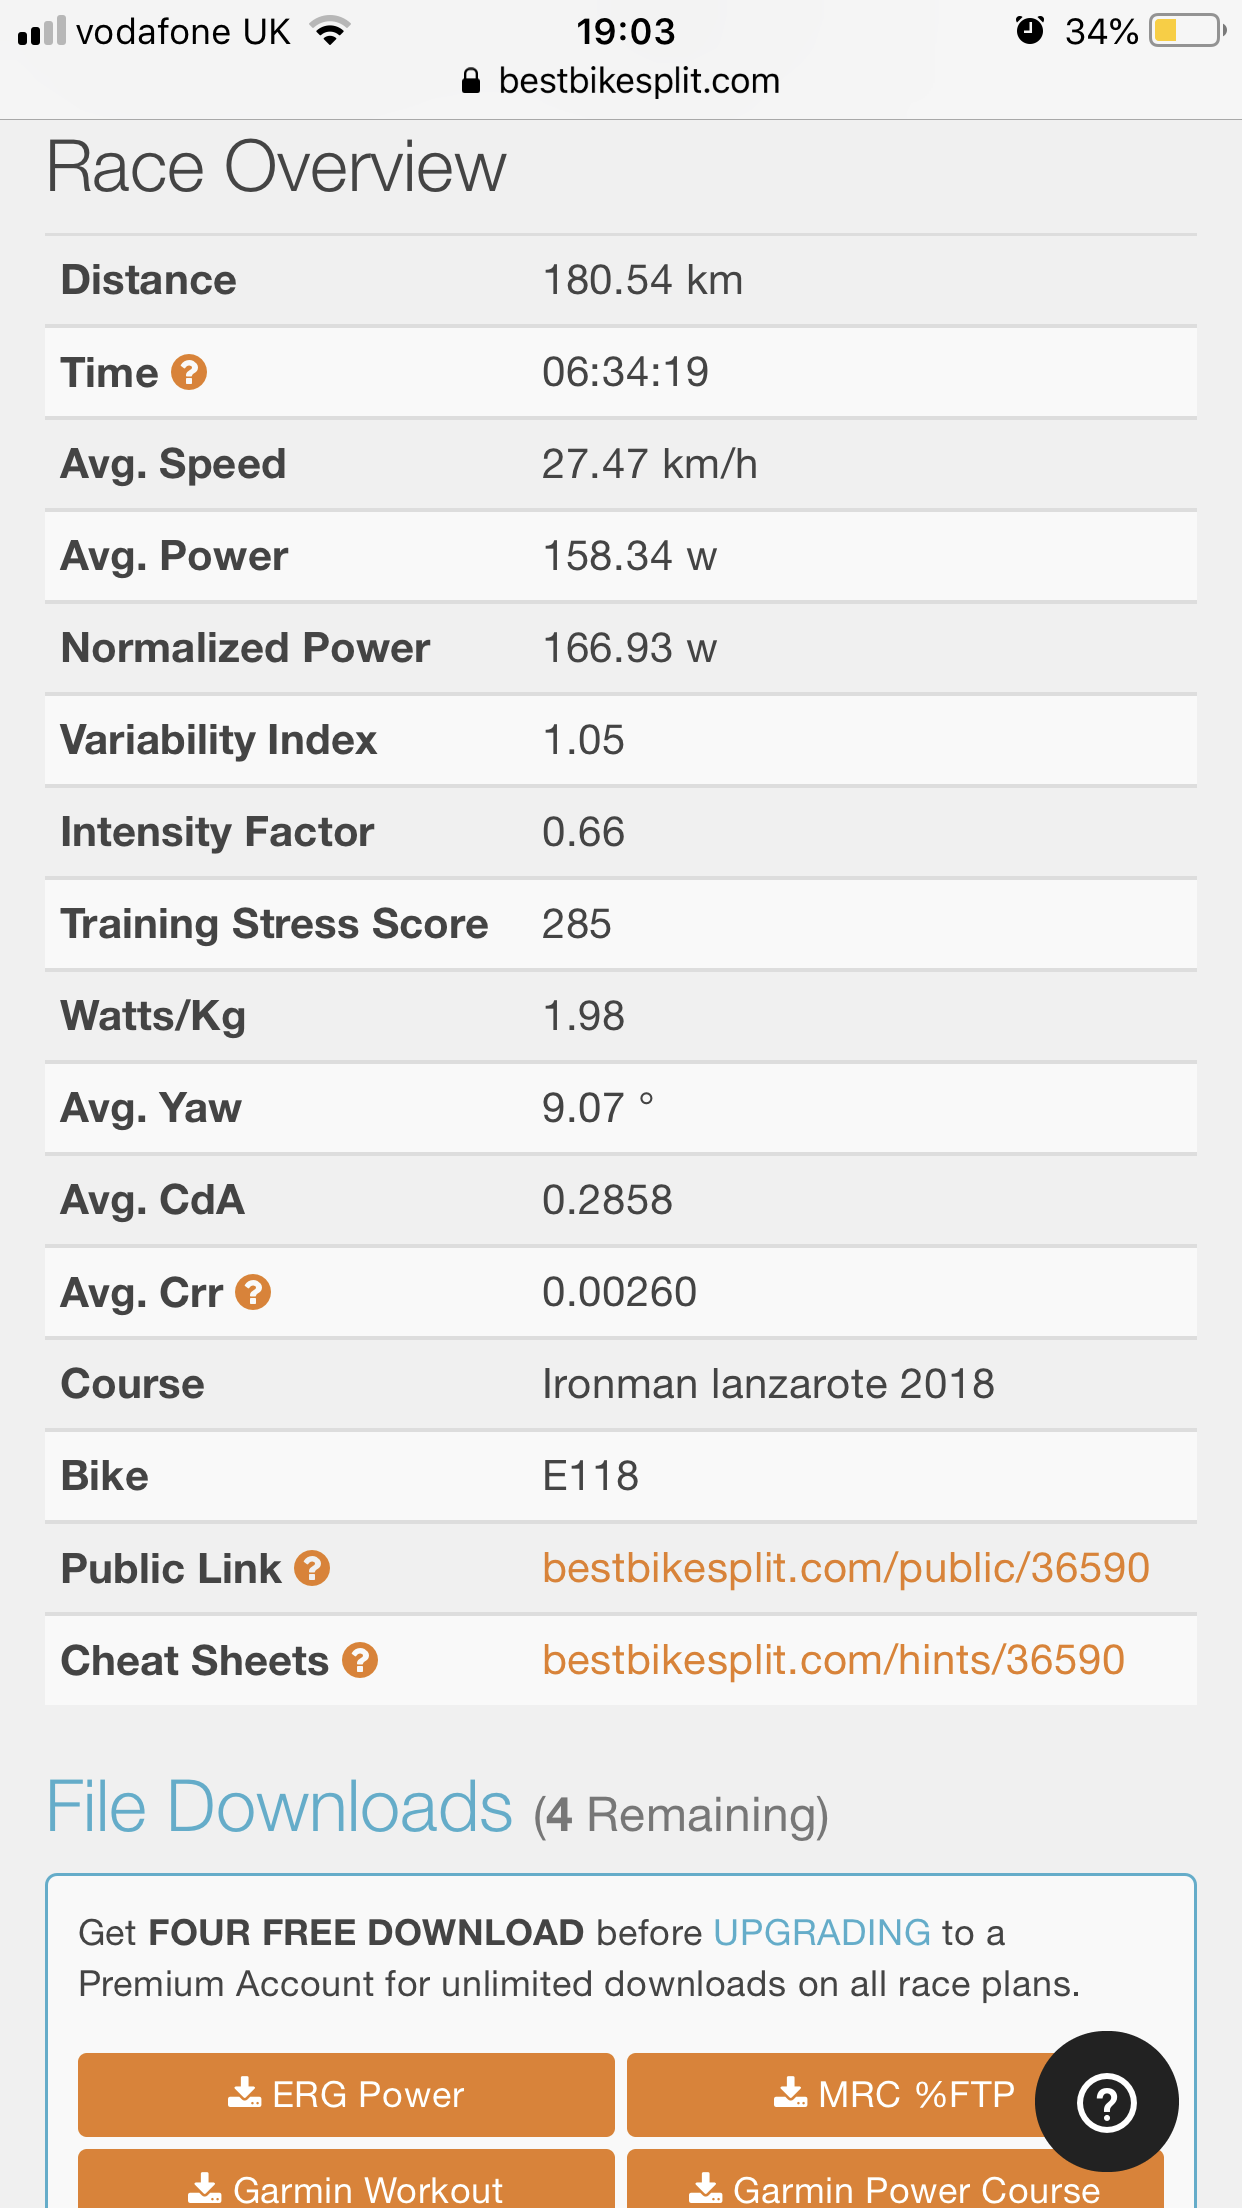
I’m having a look at the BBS output for Lanza and comparing it to some of my Strava rides.
(My ftp is 254)
Ive done my own summary and it suggest I ride:
the descents at <=100W,
flats at 140-155W,
inclines (2-4% gradient) at 165-175W,
climbs (5-8%) at 180-190W and
the peak climbs (2 at 9%) at 200-210W.
The point of comparing this to Strava is to see if the power/speed for the gradient are similar. For inclines and peak climbs I already get similar speeds for the suggested power. On the flat I tend to ride at 170W but don’t get the speed BBS thinks I’ll get. And for climbs I also tend to put in more power and get less speed.
So I’m not sure how much faith I can put into BBS stats.
Precisely what are you comparing to out of interest?
Rides in the UK? You’ll be surprised how much a difference the road surface makes in terms of crr, assuming you selected either “average” or “poor” (or whatever they are) when you ran the aero analyser, and selected at least “good” for Lanza.
You also need to make sure weights, etc, were accurate when originally running the aero analyser, and what they’ll be in your assumed race. I’m assuming you ran the aero analyser based on a file with exact race setup (bike, wheels, clothing, helmet) - are you comparing the predicted times/speeds/powers to strava rides with the exact same setup as well?
The thing missing from BBS in my opinion is an easy way to do after-race analysis. By that, I mean comparing the suggested power plan to what you actually did, and then how the actual times/speeds compare segment by segment. But all my races have been pretty close. At least within the margins of error.
Here’s some examples of power plans I’ve made with BBS, and my actual performance with some associated commentary…
December 2018 - Bahrain 70.3
BBS prediction: NP 204 = 2:26:52 (https://www.bestbikesplit.com/public/115057)
Result: NP 203 = 2:20:27
Rationale: riding alongside fast moving traffic for most of the ride was a massive advantage in cda terms. The aero analyser suggested my cda should come down massively afterwards, when I’d actually not changed anything.
August 2018 - Ironman Copenhagen
BBS prediction: NP 183 = 5:08:03 (https://www.bestbikesplit.com/public/109450)
Result: NP 170 = 5:18:38
Rationale: I just didnt feel great on the bike on the day, and RPE meant I decided to back off a bit from the original plan. I did a refreshed simulation of BBS based on my actual power, and it came out with a revised 2:22, so within 5mins which is pretty close (https://www.bestbikesplit.com/public/110555)
1 Like
Thanks - I hadn’t looked at the settings for a while, and I had Aero position set to Recreational, where the FAQ says Advanced for “most triathletes with a bike fit”. Significant change in time and TSS!
I honestly don’t know what the road surface or course condition settings should be for Lanza and there is little guidance. Good and Mountainous?
There is a Race Analyser feature that allows you to upload your power file from a race - have you tried that? Probably a Premium license required.
I would say those are sensible. The road surfaces in Lanza are, in general, a world apart from what we have to suffer with in the UK. You fly along for the same effort.
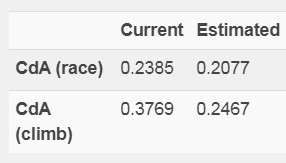
That seems to be what they’ve renamed the aero analyser to now be called. That’s how you can estimate your cda. I’m fairly sure you can run three simulations in there on a basic membership (I have an annual subscription up to the end of the month, but remember being able to do that before subscribing). If you havent done that yet, I would suggest you do. You need to pick the right file to upload however - one with good power data, and where you were in the exact same setup (kit, wheels, position) you intend to use on race day.
For shits and giggles I just ran a simulation for the etape. I only have my TT bike setup in there, but even on that it’s saying 8hrs at 0.65 IF. The final 35k climb it’s saying will take 3hrs ![]()
2 Likes
Hmm, well I’ve played about with various intensities. 0.66 seems to be the sweet spot according to BBS for a TSS of 285. Between 0.63 and 0.67 is between the upper and lower limits of the graph @stenard posted and I tend to fade and end with a slightly lower IF than intended anyway.
Well it’s a nice plan anyway. We’ll see what the sun, wind and legs have to say about it on the day. 